

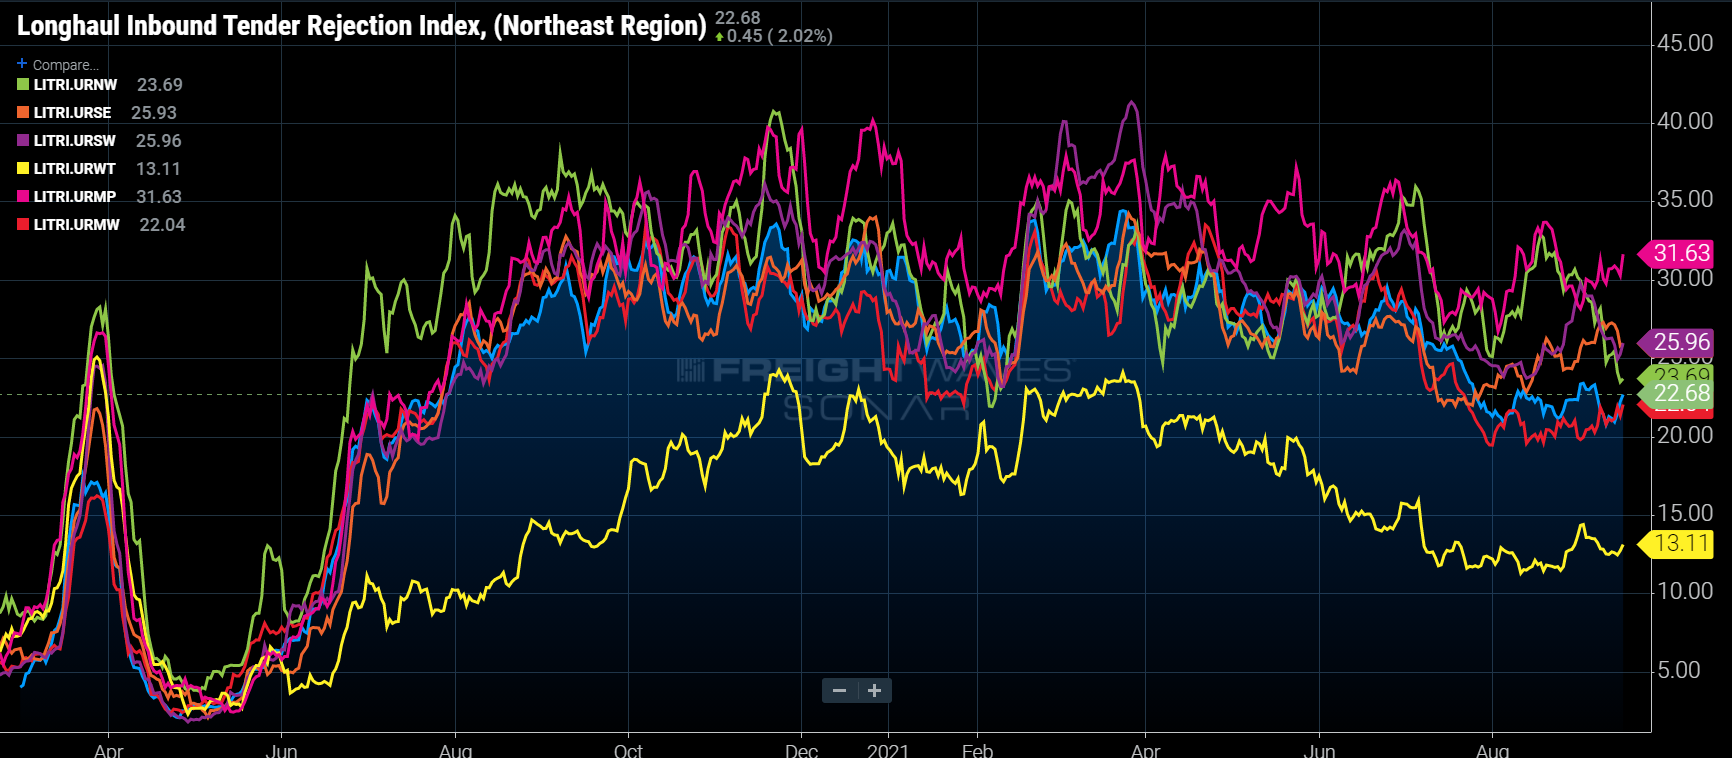
Chart of the Week: Longhaul Inbound Tender Rejection Index – Regional – USA SONAR: LITRI.URNE, LITRI.URNW, LITRI.URSE, LITRI.URSW, LITRI.URWT, LITRI.URMP, LITRI.URMW
Carriers have a clear preference in terms of where they are trying to position themselves in the U.S. and it illustrates just how unbalanced transportation capacity continues to be. Loads traveling more than 800 miles (long haul) to the West Coast have been rejected at nearly half the rate of any other region in the continental U.S. over the past two months (long haul is used to eliminate loads that move intra-region). As long as the freight market remains as polarized as the U.S. political system, capacity will be an issue, which could lead to even higher rates.
It is no secret that there have been literal boatloads of freight available to move out of Southern California over the past year. This overwhelming amount of freight largely moves in one direction, west to east, throwing transportation capacity further out of balance.
Most of the nation’s imports come from China and other Asian countries and head east on container ships to get to the U.S. Most of those goods enter the country through the ports of Los Angeles and Long Beach, the nation’s largest port complex.
The LA markets are home to one of the largest warehousing and distribution center complexes in the country, known as the Inland Empire. Most of the nation’s largest shippers own and operate facilities in this area, making it a hotspot for surface transportation activity.
With the gross majority of the freight demand growth arising from consumer goods, there is an increasing flow of trucks moving toward the nation’s consumption centers on the East Coast. The result has been rates increasing more significantly moving to the East than West. This is illustrated clearly by spot rates over the past year.

The spot rate for loads moving from LA to Dallas have increased over $2 per mile since May of 2020, while rates for loads moving from Dallas to LA have only risen around 40 cents per mile.
The problem with this setup is that most of the large cities no longer produce material goods or raw materials that ship on trucks or move back west. This means carriers will either sit for long periods of time or have to drive to find more freight to move them back to the West. As the imbalance grows so does the rate disparity.
Knowing all of this information, the most surprising thing may be that the long-haul inbound rejection rate to the West Coast region is actually above 10%. Some of the West Coast region does include unappealing destinations like Phoenix and Las Vegas, where consumption outweighs supply, but the inbound rejection rate to Los Angeles is over 11%, not far from the inbound regional average. For context, a rejection rate range when the market is well supplied, such as 2019, is 2% to 3%.
Knowing that carriers are pricing themselves back into Southern California and still unable to cover loads consistently means we are experiencing a true capacity crunch as this number represents the amount of times carriers simply do not have the equipment to cover the demand. But even when capacity rises to meet demand, the large imbalance between East and West will still persist.
About the Chart of the Week
The FreightWaves Chart of the Week is a chart selection from SONAR that provides an interesting data point to describe the state of the freight markets. A chart is chosen from thousands of potential charts on SONAR to help participants visualize the freight market in real time. Each week a Market Expert will post a chart, along with commentary, live on the front page. After that, the Chart of the Week will be archived on FreightWaves.com for future reference.
SONAR aggregates data from hundreds of sources, presenting the data in charts and maps and providing commentary on what freight market experts want to know about the industry in real time.
The FreightWaves data science and product teams are releasing new data sets each week and enhancing the client experience.
To request a SONAR demo, click here.
